
For wheat breeders, the moment of truth arrives only at harvest, when combines roll through yield trials and the season’s worth of breeding decisions is finally tallied. But a new multi-year study from Texas A&M AgriLife Research suggests that most of the information needed to predict that final yield is concentrated in a remarkably narrow slice of the growing season. By combining drone-based imaging, machine learning, and explainable artificial intelligence, researchers have pinpointed a critical window centered on heading, the stage when wheat shifts from vegetative growth to reproduction, and shown that flights outside this window contribute surprisingly little predictive value.
The study, published in Smart Agricultural Technology, draws on four growing seasons of winter wheat yield trials conducted from 2017 to 2021 at the Texas A&M AgriLife Research Experiment Station in Bushland, Texas. The trials spanned both dryland and sprinkler-irrigated conditions and represented Years 7 through 12 of the university’s wheat breeding pipeline, encompassing preliminary through advanced yield testing. Across those seasons, environmental conditions varied dramatically, including terminal drought in 2018 and 2020, optimal precipitation in 2019, and average rainfall in 2021, providing a robust test bed for models that must cope with real-world variability.
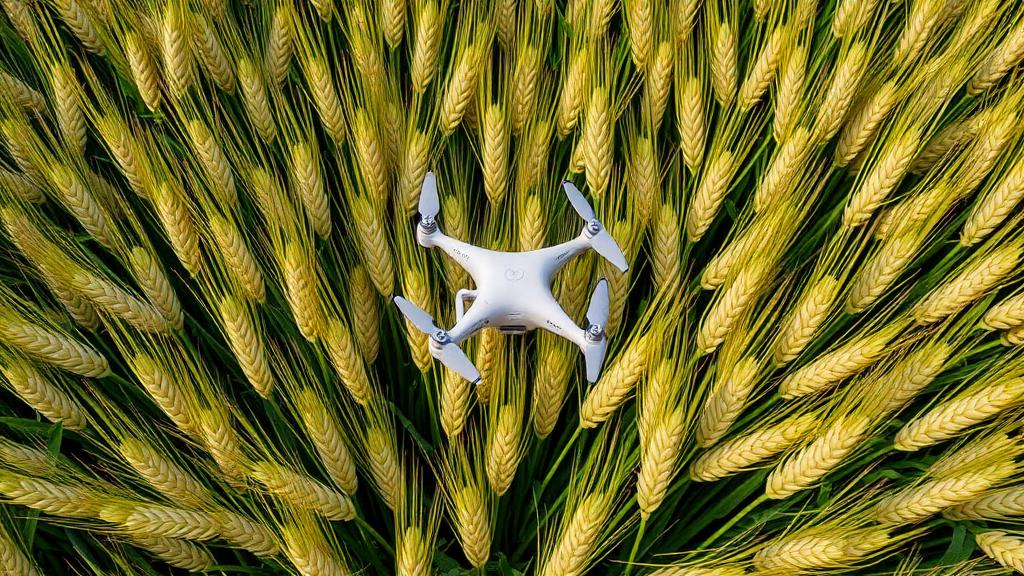
Throughout each eight-month growing season, the team flew unoccupied aerial systems over the breeding nurseries, using a DJI Phantom 4 Pro with an RGB sensor and a DJI Matrice 100 carrying a SlantRange 3P multispectral sensor. Between 20 and 32 flights were conducted per season per environment, capturing everything from early vegetative growth through senescence. From the multispectral imagery, the researchers derived three vegetation indices: the normalized difference vegetation index (NDVI) for canopy vigor, the normalized difference red-edge index (NDRE) for chlorophyll content, and the excess green index (ExG) for visible greenness. Radiometric calibration with in-field reflectance panels and survey-grade ground control points ensured that the imagery was spatially and spectrally consistent across years.
One of the study’s key methodological innovations lies in how it handles time. Most previous drone-based yield prediction studies aligned observations by calendar date or days after planting, an approach that breaks down when planting dates shift and weather patterns differ between seasons. The same calendar date can represent entirely different physiological stages in different years. Instead, the researchers aligned every flight using days relative to heading, or DRH, calculated as the flight date minus the date when 50 percent of heads in a plot reached the Feekes 10.3 stage. Heading is a biologically meaningful milestone that marks the transition into reproductive development and is closely tied to the processes that determine grain number, a major component of final yield. Because heading date is already routinely recorded in breeding programs, this alignment framework can be adopted without collecting any additional specialized trait.
With the temporally aligned dataset in hand, the team trained a diverse suite of machine learning models, including Ridge regression, Elastic Net, partial least squares regression, Random Forest, Extra Trees, XGBoost, and a fully connected neural network. Hyperparameters were tuned with Bayesian optimization, and each model was evaluated across 100 repeated random train-test splits to ensure robust performance estimates. The tree-based ensembles dominated: Extra Trees and XGBoost achieved root-mean-square errors of 6.12 and 6.13, respectively, with R-squared values of 0.953, and roughly 68 percent of their predictions fell within 10 percent of observed yield. Pairwise Wilcoxon signed-rank tests with Holm correction confirmed that these two models significantly outperformed all others, while showing no statistically significant difference from each other. Linear models clustered around RMSE values of 8.0 to 8.5, and the neural network performed far worse, with an RMSE near 19, likely because the tabular dataset was too small and structured for deep learning to shine.
But accuracy alone was not the goal. The researchers wanted to know why the models worked and when, in the crop’s development, the predictive signal was strongest. To answer this, they built an explainable AI framework with two complementary components. First, they extracted model-specific feature importance from each algorithm: impurity-based measures for the tree ensembles, absolute regression coefficients for the linear models, and latent-component weights for PLSR. Second, they validated these rankings with permutation importance, a model-agnostic technique that measures how much prediction accuracy drops when a single feature’s values are randomly shuffled in held-out test data. Because permutation importance directly evaluates changes in performance on unseen data, it is less susceptible to the biases that can distort model-specific metrics when predictors are correlated.
The results converged with striking consistency. Temporal correlation analysis showed that the relationship between vegetation indices and yield rose steadily through the vegetative stage and peaked near heading. The ExG index reached its maximum correlation with yield, an absolute r of 0.86, exactly at heading (DRH 0), while NDVI and NDRE peaked slightly earlier, between 15 and 10 days before heading, with correlations of 0.81 and 0.83. Feature importance analysis told the same story: the most influential predictors across the tree-based models were packed into the window from roughly 25 days before heading to one day after, with ExG at one day after heading emerging as the single most important feature for XGBoost and NDRE at 15 days before heading dominating for Random Forest. Irrigation also ranked as a major driver of yield variability, confirming the dominant role of water management in the Texas High Plains.
The physiological explanation for this heading-centered window is compelling. In the weeks preceding anthesis, wheat undergoes rapid spike growth and floret development, during which assimilate availability strongly influences floret survival and, ultimately, grain number. Canopies that maintain greater green leaf area, chlorophyll content, and biomass accumulation during this period have more capacity to support both spike growth and photosynthesis as the crop enters reproduction. NDRE is particularly informative here because red-edge reflectance remains sensitive to chlorophyll variation even under dense canopies, where NDVI begins to saturate. ExG, meanwhile, captures visible greenness right at the transition. Together, the three indices integrate complementary aspects of canopy condition during the very period when the crop’s reproductive sink strength is being established, which is why spectral differences detected near heading carry so much predictive weight.
The framework also proved its mettle under the toughest test: predicting entirely unseen growing seasons. Using a leave-one-year-out validation scheme, in which each season was held out once as an independent test set, the ensemble tree models consistently outperformed linear and neural network approaches. Even under these shifted conditions, feature selection analysis revealed that the most reliable predictors clustered between 15 days before and 10 days after heading, with ExG at one day after heading repeatedly chosen across models and test years. Early-season features, by contrast, were rarely selected and contributed little. The 2019 season proved easiest to generalize to, while 2021, with its distinct weather and management profile, produced the largest errors, underscoring the importance of training on environmentally diverse datasets.
The practical implications are immediate. Rather than scheduling uniform drone flights across the entire season, breeding programs can concentrate acquisitions in the 15 days surrounding heading, where each flight delivers maximum information per unit of cost and processing effort. The authors are careful to note that the specific window reflects the environments and germplasm evaluated at a single Texas station, and they recommend future ablation studies directly comparing flight schedules, along with testing across additional locations and sensor types. But the analytical framework itself, phenology alignment by days relative to heading, multi-model machine learning, and dual explainability validation, is not site-specific. By transforming black-box predictions into physiologically interpretable, time-resolved guidance, the study offers a template for smarter, cheaper, and more trustworthy crop monitoring, one that tells breeders not just what the drones see, but exactly when they should be looking.
Subject of Research: Phenology-aligned UAS remote sensing with explainable machine learning for winter wheat grain yield prediction
Article Title: Strategically timed UAS data acquisition for wheat yield prediction using explainable AI: A multi-year phenology-aligned study
Article References: Baker, S., Islam, M. N., Bhandari, M., Chang, A., Ibrahim, A. M., Jung, J., Landivar, J., Liu, S., Mudumba, V. S., Pokharel, R., Rudd, J., Scott, J. L., & Gentimis, T. (2026). Strategically timed UAS data acquisition for wheat yield prediction using explainable AI: A multi-year phenology-aligned study. Smart Agricultural Technology, 15, Article 102606. https://doi.org/10.1016/j.atech.2026.102606
Image Credits: AI Generated
DOI: 10.1016/j.atech.2026.102606
Keywords: wheat, yield prediction, drones, UAS, explainable AI, machine learning, phenology, vegetation indices, high-throughput phenotyping, plant breeding, precision agriculture, NDVI