
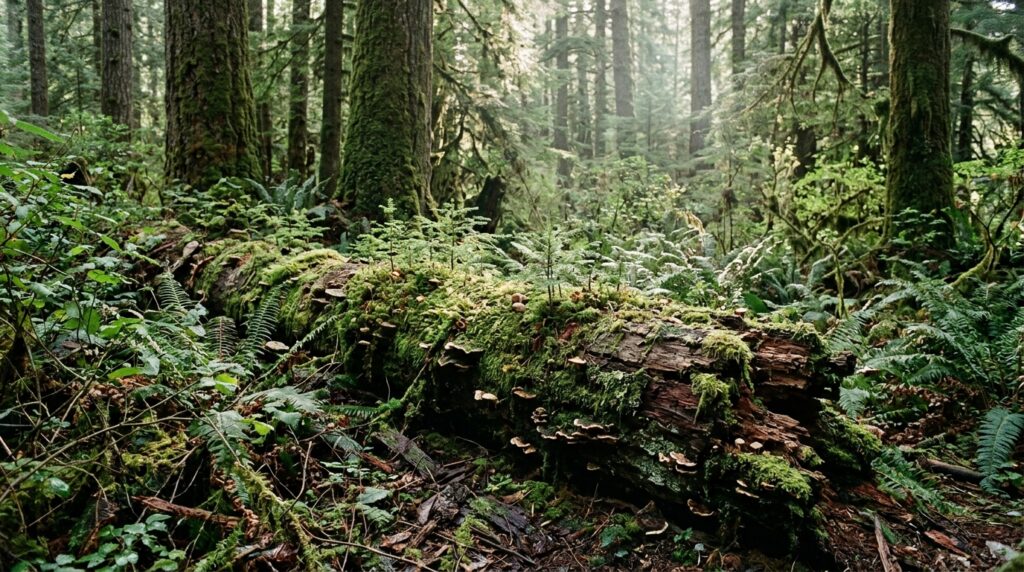
Forests left alone to grow old quietly accumulate the structures that wildlife depends on, but a widely used rapid assessment tool may be undercounting those gains. A new study in Annals of Forest Science applied the Index of Biodiversity Potential, or IBP, to 42 paired managed and unmanaged forest patches in central Belgium and found that the index rises steadily with time since management ceased, driven mainly by accumulating deadwood, very large trees and tree-related microhabitats. The catch: in many plots the raw field values blew far past the thresholds the capped index uses to award its maximum scores, meaning the official total understates how different set-aside forests really are from their managed neighbours.
The IBP was originally developed in France as a fast, cost-efficient way for forest managers to gauge how well a stand could host biodiversity without measuring complex species data directly. It rests on ten science-based criteria: native tree species richness, vertical stand structure, standing deadwood, lying deadwood, very large trees, habitat trees, canopy openness, forest temporal continuity, wet macrohabitats and rocky macrohabitats. Each criterion is scored from 0 to 5 based on preset upper thresholds; once a threshold is reached, counting stops and the maximum score is locked in. An uncapped variant keeps counting beyond the threshold, but because it has no scoring system, no total index value can be calculated and criteria must be judged individually.
The research team, led by Yannick De Win and Jonas Simons with colleagues including Kris Vandekerkhove, Ellen Desie, Ben Somers, Koenraad Van Meerbeek and Bart Muys, tested the Benelux version of the index, only recently finalised with adaptations for the region’s native tree species and forest continuity sources. Their study area was the National Park Brabantse Wouden, a set of connected forest areas at the heart of Belgium with mean annual temperature of 11 degrees Celsius and 837 millimetres of annual precipitation. The loamy soils there rank among the most fertile forest soils in northern Belgium, and most of the woodland has been continuously forested for at least 250 years.
The forests themselves are mature mixed oak-hornbeam and beech stands between 100 and 200 years old, plus roughly 100-year-old pine stands on sandy outcrops. Most are subject to close-to-nature forestry with regular thinnings and group fellings, while strict reserves set aside between 1984 and 2010 occur in all forest types. Sampling drew on paired managed and unmanaged patches from the INFORMA Forest Management Platform, a database designed to minimise moderator effects such as soil type, topography, climate, forest type and land use legacies. One-hectare circular plots were laid out randomly at a density of one plot per ten hectares, totalling 86 plots, and field data were collected in the summer of 2024 using the uncapped approach so raw counts could later be compared against capped scores.
Analysis with generalised linear mixed models showed unmanaged forests held higher mean values for almost every criterion. They contained 3.5 versus 1.2 large pieces of lying deadwood per hectare, 6.6 versus 3.3 medium-sized pieces of lying deadwood, 6.8 versus 4.3 large standing dead trees, 16.6 versus 15.8 medium-sized standing dead trees, 6.9 versus 4.3 very large living trees, and 3.6 versus 3.2 native tree species per hectare. The capped IBP itself averaged 24.0 in unmanaged forests against 19.6 in managed ones. Only large living trees in the 47.5 to 67.5 centimetre diameter range were denser in managed stands, at 58.4 versus 53.3 trees per hectare, because mature broadleaved trees had largely outgrown that class.
The index increased with time since set-aside, with an effect size of 0.007, corresponding to a 0.7 percent change per year of non-intervention. That trend was mainly driven by increases in large lying deadwood, very large living trees and large standing deadwood, the criteria that also most frequently surpassed the capped maximum thresholds, especially in unmanaged forests. Several microhabitats showed significant rising trends too: rot-holes with an effect size of 0.027, perennial fungal fruiting bodies at 0.020, and epiphytic or parasitic crypto- and phanerogams at 0.032. Because microhabitat thresholds are low and the categories are aggregated into one score, these shifts contributed less to the total. The effect of non-intervention tended to be stronger in broadleaved than coniferous stands, though that difference was not statistically significant, likely due to a lack of observations and statistical power.
Threshold overshoot was striking. Large standing deadwood exceeded the maximum threshold in 83 percent of unmanaged plots and 52 percent of managed plots; very large trees in 53 percent versus 35 percent; large lying deadwood in 43 percent versus 11 percent; and native tree species in 15 percent versus 9 percent. For 7 of 19 criteria, registered values exceeded the original thresholds by a factor of 2. Most microhabitats, by contrast, stayed below their upper limits, with exceedances only for epiphytic or parasitic crypto- and phanerogams and concavities, slightly more frequent in unmanaged forests, especially for rot-holes, twig tangles and burrs and cankers. Capped IBP scores across all plots ranged from 9 to 32 out of a theoretical maximum of 50, with the lowest values in pine stands and the highest in broadleaved stands.
Forest type shaped the picture as well. Beech-dominated stands did not differ significantly from oak-dominated stands overall, though oaks scored marginally higher on most criteria and significantly more native tree species and microsoils. Beech forms the climax vegetation on loamy lowland soils, shading out competitors and regenerating under closed canopy, which naturally homogenises tree species compared with the lighter, more open structures of oak woods that also stem from coppice-with-standards forestry. Oaks, with their rough bark, host more mosses, lichens and epiphytic algae. Pine stands systematically scored lower, reflecting their history as intensively managed monocultures on less fertile soils, a simplified structure whose legacy persists even as the stands are gradually converted to mixed forest.
The authors argue the capped index, calibrated for higher-intensity management regimes, struggles in mature forests unharvested for decades. Vandekerkhove and colleagues previously observed 10 to 75 cubic metres of deadwood per hectare in the first decades after set-aside, while the IBP threshold for a top score is reached at just three large pieces of standing or lying deadwood. Since biodiversity links positively with deadwood amounts, large tree densities and microhabitats even beyond current thresholds, the omission is ecologically relevant. Possible fixes include adjusting thresholds to regional reference levels, adding a rank above 5 for exceptionally rich stands, as discussed at the 2026 assembly of the IBP International Committee of Experts, or using the uncapped index, though that sacrifices time-efficiency and cross-study comparability.
For practitioners, the study suggests the current IBP remains well suited to quick scans of biodiversity potential and to tracking recovery in the first 30 to 40 years after management cessation, after which an adjusted or uncapped version may serve better for mapping stands of highest conservation value. The index is a local comparative tool rather than a monitoring instrument, since its scores change gradually and cannot detect subtle shifts over the six-year reporting periods demanded by European frameworks such as the Nature Restoration Law, so it should be paired with other monitoring when detail matters. In the first decades after set-aside, the species that benefit most are those depending on continuity of forest conditions and structural features such as overmature trees and deadwood, while light-loving vascular plants and primary consumers may not gain, and in this study no flower-rich areas were recorded in either managed or unmanaged stands.
Subject of Research: Testing whether the Index of Biodiversity Potential distinguishes managed from recently set-aside mature temperate lowland forests in Belgium
Article Title: Comparing the Index of Biodiversity Potential (IBP) in managed and unmanaged temperate lowland forests
Article References: De Win, Y., Simons, J., Vandekerkhove, K., Desie, E., Somers, B., Van Meerbeek, K., & Muys, B. (2026). Comparing the Index of Biodiversity Potential (IBP) in managed and unmanaged temperate lowland forests. Annals of Forest Science, 83(1), Article 33. https://doi.org/10.1186/s13595-026-01351-9
Image Credits: AI Generated
DOI: 10.1186/s13595-026-01351-9
Keywords: Index of Biodiversity Potential, forest biodiversity, deadwood, tree-related microhabitats, set-aside forests, close-to-nature forestry, temperate lowland forest, Belgium, very large trees, forest management, uncapped IBP, National Park Brabantse Wouden